Who Pays for the Power?
The price a household pays for electricity has risen. The data centres Epoch tracks draw thousands of megawatts, in 26 states. Setting the two side by side cannot say who pays, and the piece says why. In one regional market the cost of keeping power ready has gone to its cap. Two findings point opposite ways, for different years and different places. And the House has passed a bill that asks the states to consider who should pay.
The price
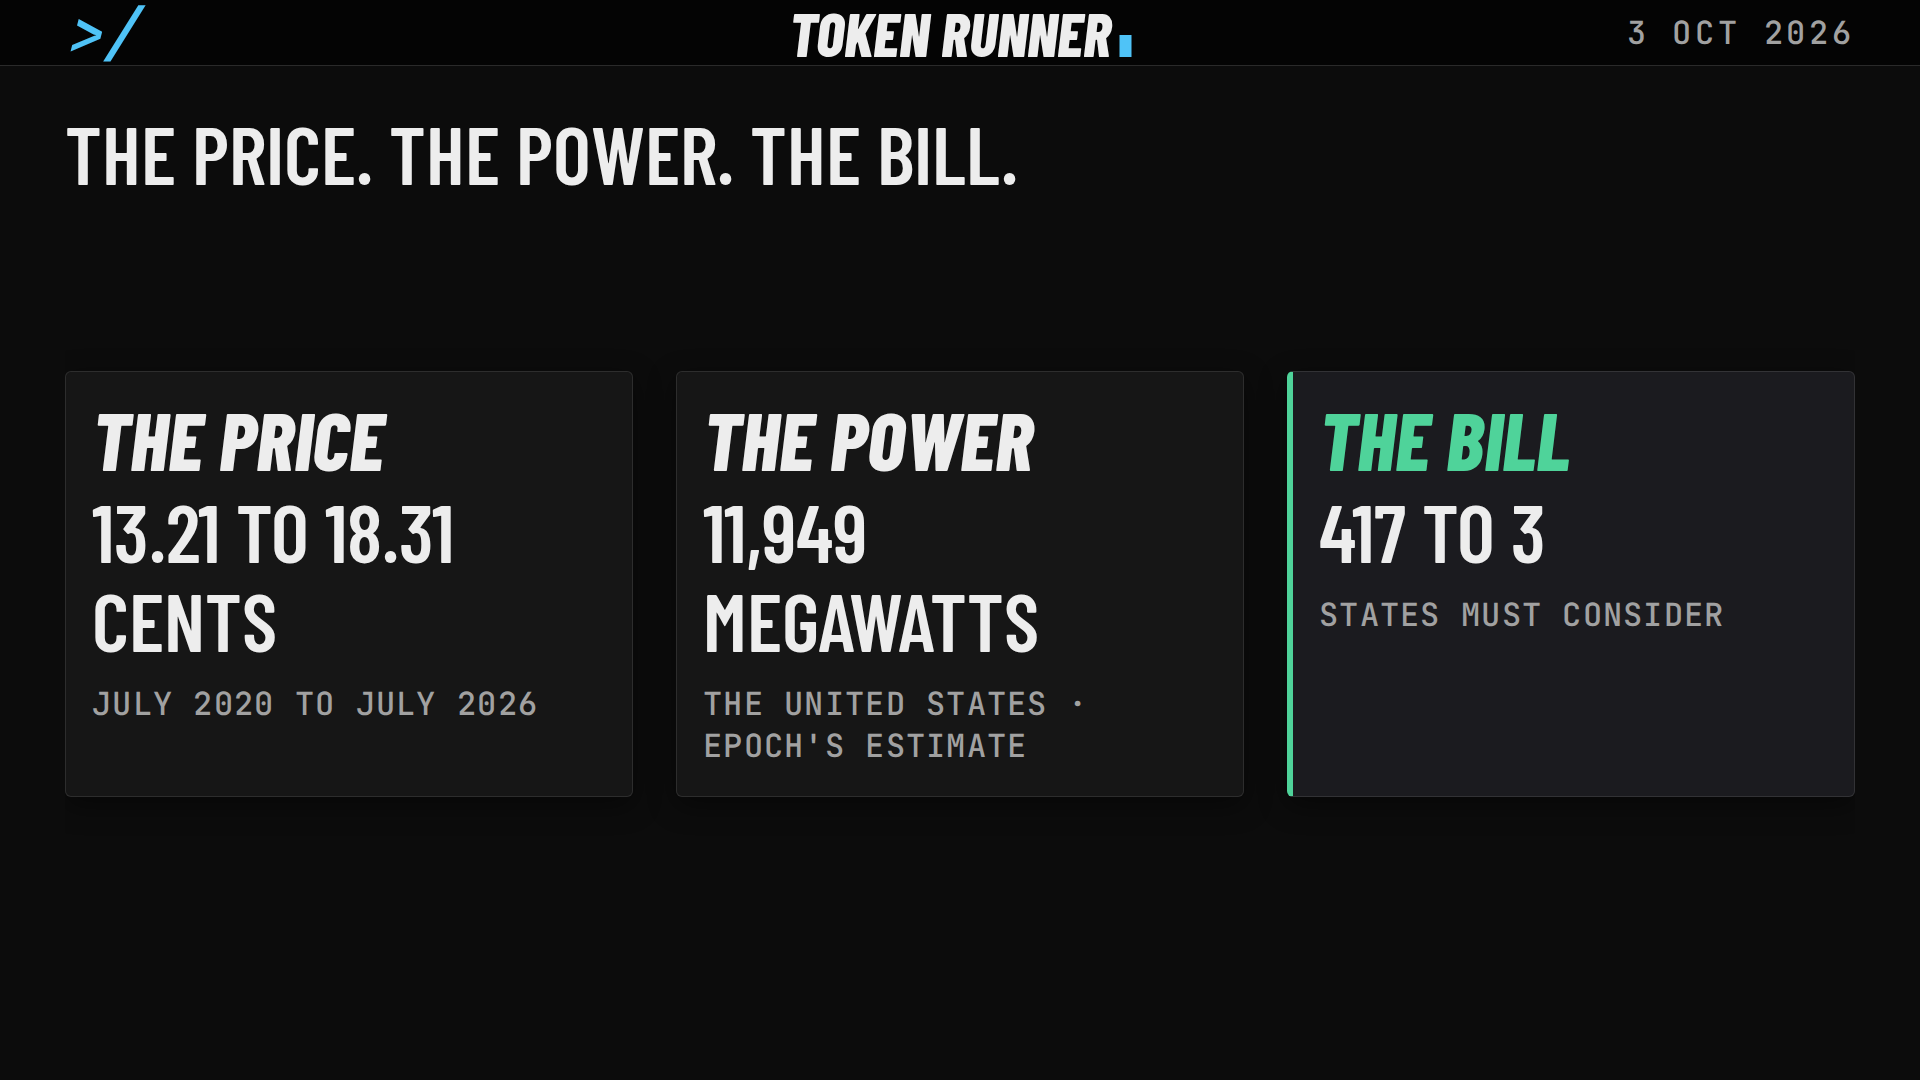
In July 2020 the average American household paid 13.21 cents for a kilowatt-hour of electricity. In July 2026 it paid 18.31, by the Energy Information Administration's monthly count: 5.10 cents more, a rise of 38.6 per cent. July is set against July because summer prices run higher. Households pay the most of the three kinds of customer. Businesses paid 14.53 cents in July 2026, against 10.84 six years before, and industry 9.77, against 7.16. In cents the household price rose most; as a share the three rose by about the same, between 34 and 39 per cent. These are national averages. Fuel, wires, storms and inflation move them as well as demand, and the table does not say which did.
The power
Epoch AI, a research group, tracks AI data centres site by site and estimates what each one draws. In its file as Token Runner collected it on 9 October 2026, the United States has 77 sites, and the 60 with a power figure come to about 11,851 megawatts. The other 17 read zero, and the file does not say why. The two largest are Colossus 2, which the file gives to SpaceXAI, at about 946 megawatts, and Anthropic-Amazon New Carlisle, at about 910; the third is 636. Every megawatt here is an estimate for a site Epoch tracks. It is not a meter reading, and it is not every data centre in the country. The file also moves: a week earlier it gave 58 sites and 11,949 megawatts, the figures the film above was made with.
Where it sits
Placed by state from each site's address, the megawatts sit in 26 states. Five hold more than a thousand each: Ohio about 1,457, Tennessee 1,373, Texas 1,327, Indiana 1,088 and Virginia 1,044. In the file of a week earlier, the one the film used, Texas stood ahead of Tennessee. Added up, that is 6,289 megawatts, a little over half of the American total. Two more states have a site that reads zero. Twenty-five of the fifty states and the District of Columbia have no megawatts in the file, which means absent from one research group's list, not free of data centres. The chart shows the five, each state's sites set end to end; the next sets beside them what their households pay. Beside, not because: nothing in either table says that one moved the other.
What households pay there
In Ohio the household price went from 12.26 cents in July 2020 to 19.45 in July 2026, and in Virginia from 12.21 to 17.55. Both rose by more than the nation's 5.10 cents. Tennessee, from 10.72 to 13.71, Texas, from 11.59 to 15.88, and Indiana, from 12.51 to 16.73, rose by less. Across all fifty states and Washington, D.C., the middle price in July 2026 was 15.93 cents in the 26 states with tracked megawatts and 19.22 in the 25 without. In July 2020 the two groups were nearly level, at 12.23 and 12.69. So over six years the price rose less where the tracked data centres are. That is what the table shows. It is not an answer to the question in the title.
Why the table cannot answer
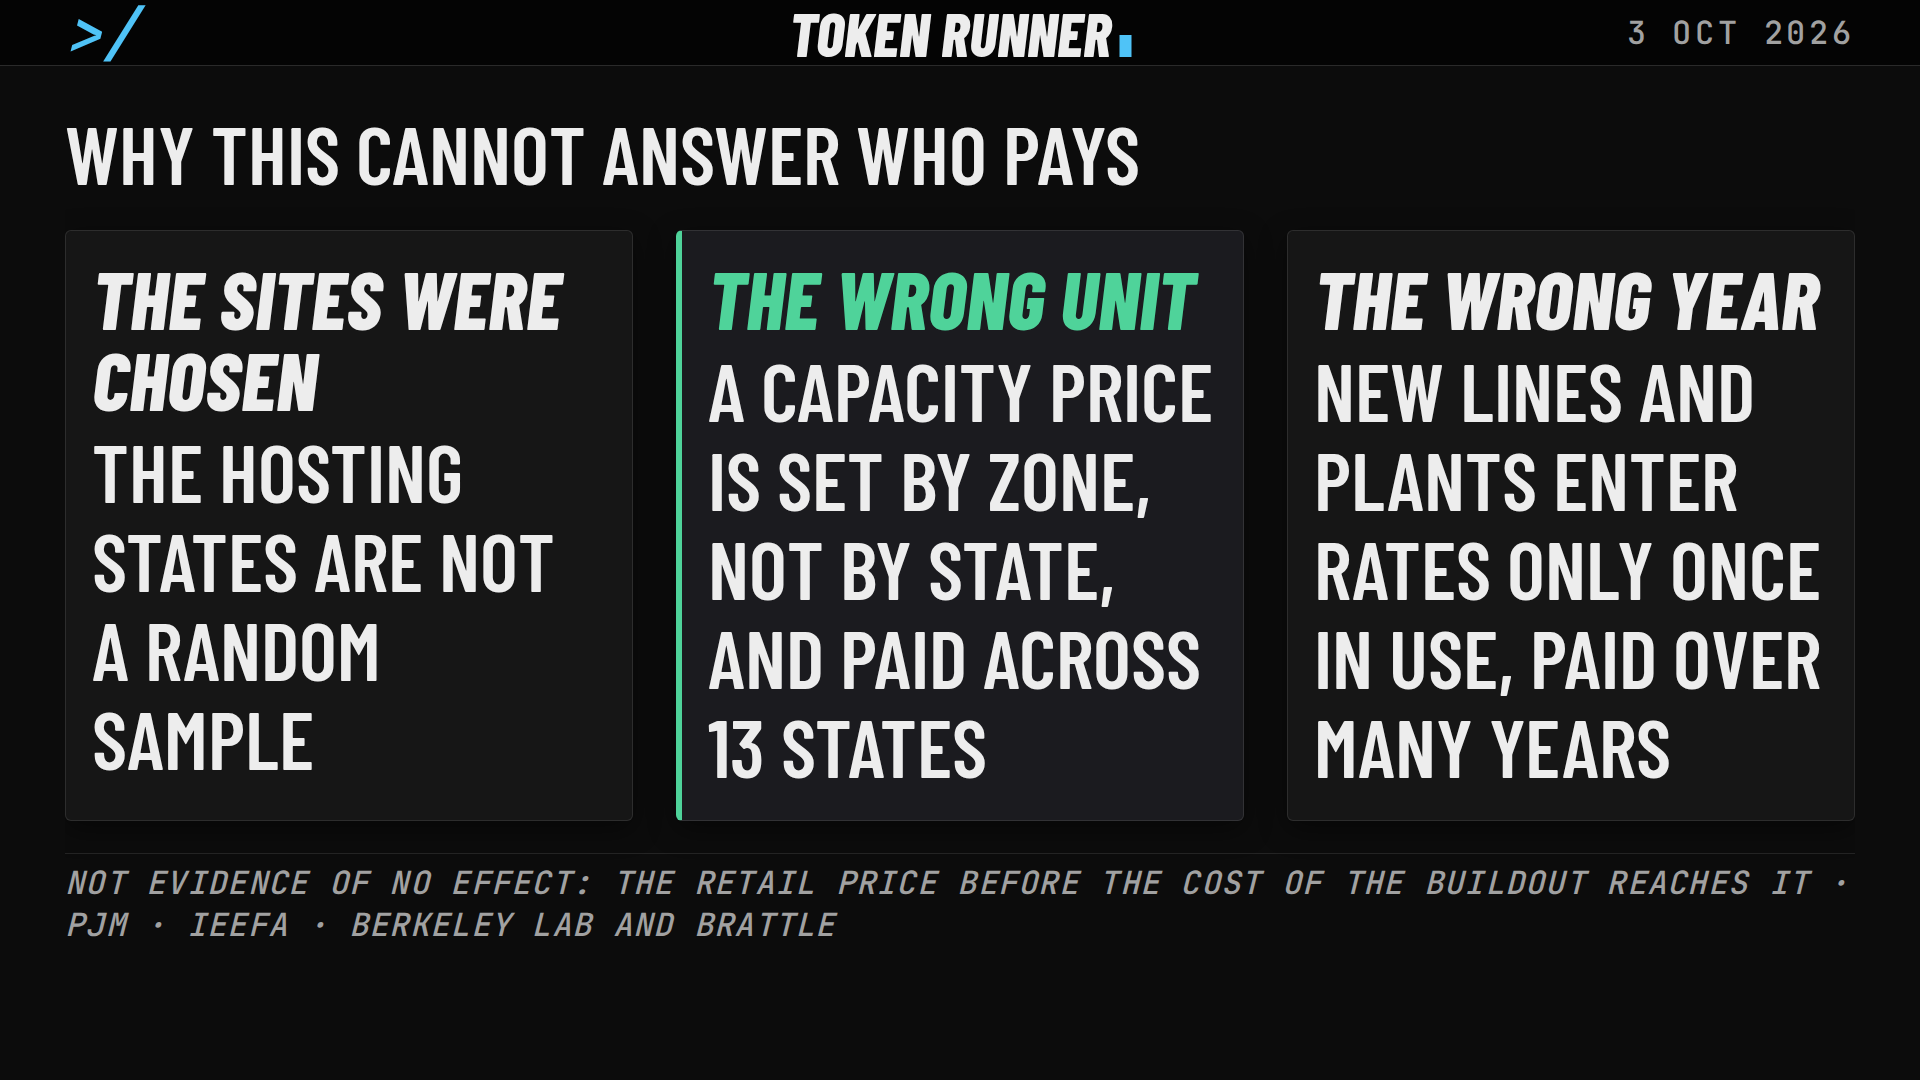
There are three reasons. The sample: the sites were chosen, so the hosting states are not a random draw, and a table like this is not evidence of no effect. The unit: the cost of keeping power ready is set for a zone of the grid, not for a state. PJM, the largest regional market, covers 13 states and the District of Columbia, and its latest auction set one price "for the entire PJM footprint"; the Institute for Energy Economics and Financial Analysis, IEEFA, writes of "ratepayers across the region" paying. The year: Berkeley Lab and the Brattle Group write that a new line or plant "must be deemed used and useful to be put in the rate-base" and is then paid for over many years, and that one auction's price was "not felt in retail electricity prices until mid-year 2025". Much of what is being built now is not yet in the price.
Maryland
There is one state the table does speak to. Maryland's household price went from 12.22 cents in July 2020 to 21.41 in July 2026: a rise of 75 per cent, the third largest among the fifty states and the District of Columbia by Token Runner's arithmetic on the administration's rows. None of the sites Epoch tracks is in Maryland. But Maryland is inside PJM's region, and IEEFA reports an estimate that capacity prices add about $18 a month to the average home's bill in western Maryland, and about $16 in Ohio. The table does not say why Maryland's price rose, and that estimate is the only stated cause in the documents read for this article. If it is right, the load sits in one state and part of its cost lands in another.
Whose it is
Across every country Epoch tracks, the 73 sites with a power figure, of 93 listed, come to about 13,833 megawatts. The United States holds 86 per cent of that. Four owners hold about 8,685 megawatts between them, 63 per cent of the whole: Google about 3,179, Meta 2,244, Amazon 1,743 and Microsoft 1,519. Another 1,638 megawatts sit on sites whose owner the file does not give. The owners are the file's own attributions, most of them marked confident, and each sum is of Epoch's estimates across all countries, not a company's own figure and not all of its data centres. By country the picture is thin: ten countries have a figure, and seven of them have a single site.
The auction
In PJM, companies are paid to keep power ready, at a price set by auction. For the year from June 2024 it was $28.92 a megawatt-day in most zones. For the year after, $269.92, which IEEFA calls "almost nine-fold". For 2026/27 it was $329.17 in every zone, and would have been higher without a cap, by IEEFA's account. The auction for 2028/29, announced on 14 July 2026, cleared at its cap of $325, the third in a row under a price collar that PJM set with the governors of its 13 states and federal regulators. PJM's own judgment of the collar is that a cap and a floor "do not solve the underlying supply-demand imbalance". The auction's value was $16.4 billion, which PJM says is not the cost to customers, because load covered by its own supply or by contracts is not exposed to the price.
The shortfall
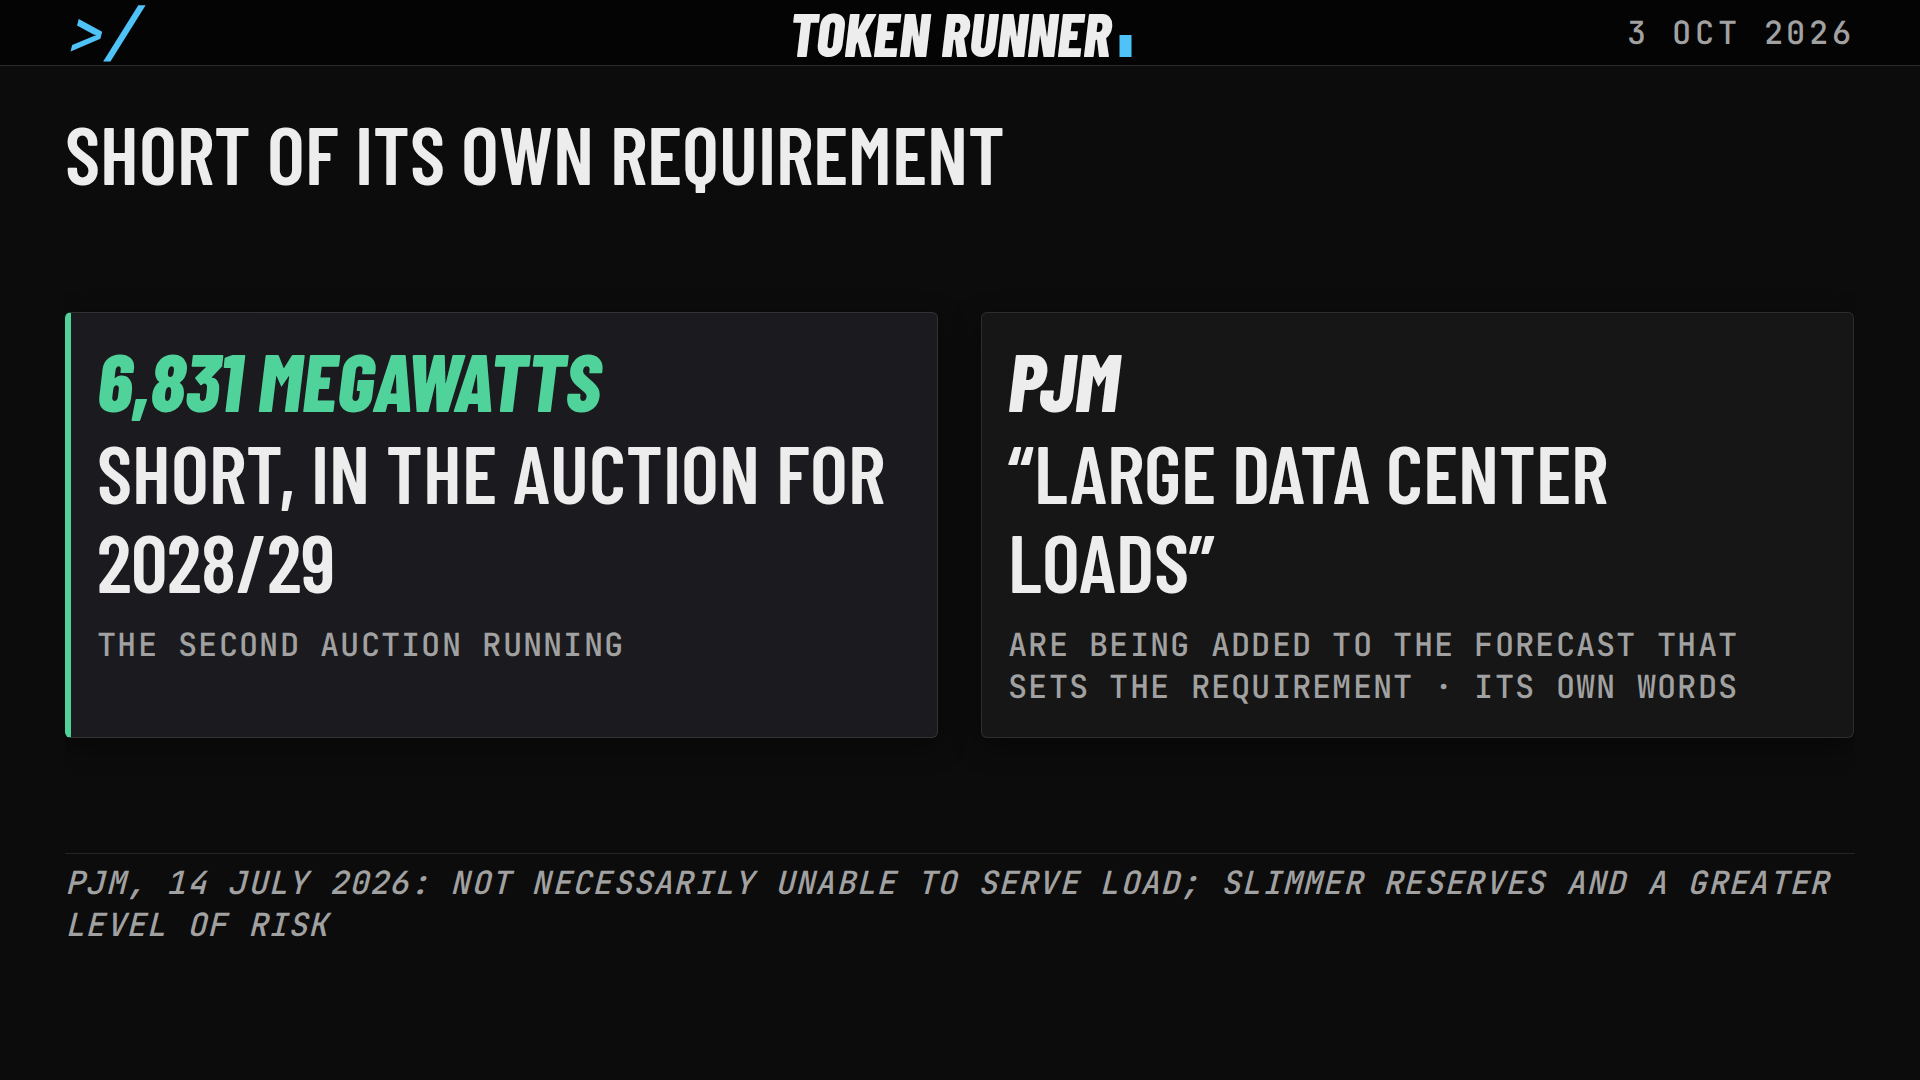
That auction bought 138,318 megawatts and still came up 6,831 short of the region's own reliability requirement, after a shortfall of about 6,500 in the auction before: the first two in PJM's history. PJM's words on what that means are careful. Such a shortage "does not necessarily mean" that it cannot serve load reliably; it means "slimmer reserves and a greater level of risk". It also says the auction "saw the continued trend of the addition of large data center loads to the load forecast" that sets the requirement. Only 525 megawatts of new generation and uprates cleared. PJM asked federal regulators for a one-time backstop purchase of new supply.
On 29 September 2026 the Federal Energy Regulatory Commission accepted the plan but suspended it for five months, the American Public Power Association reports, and the purchase did not begin on 30 September as planned.
One finding
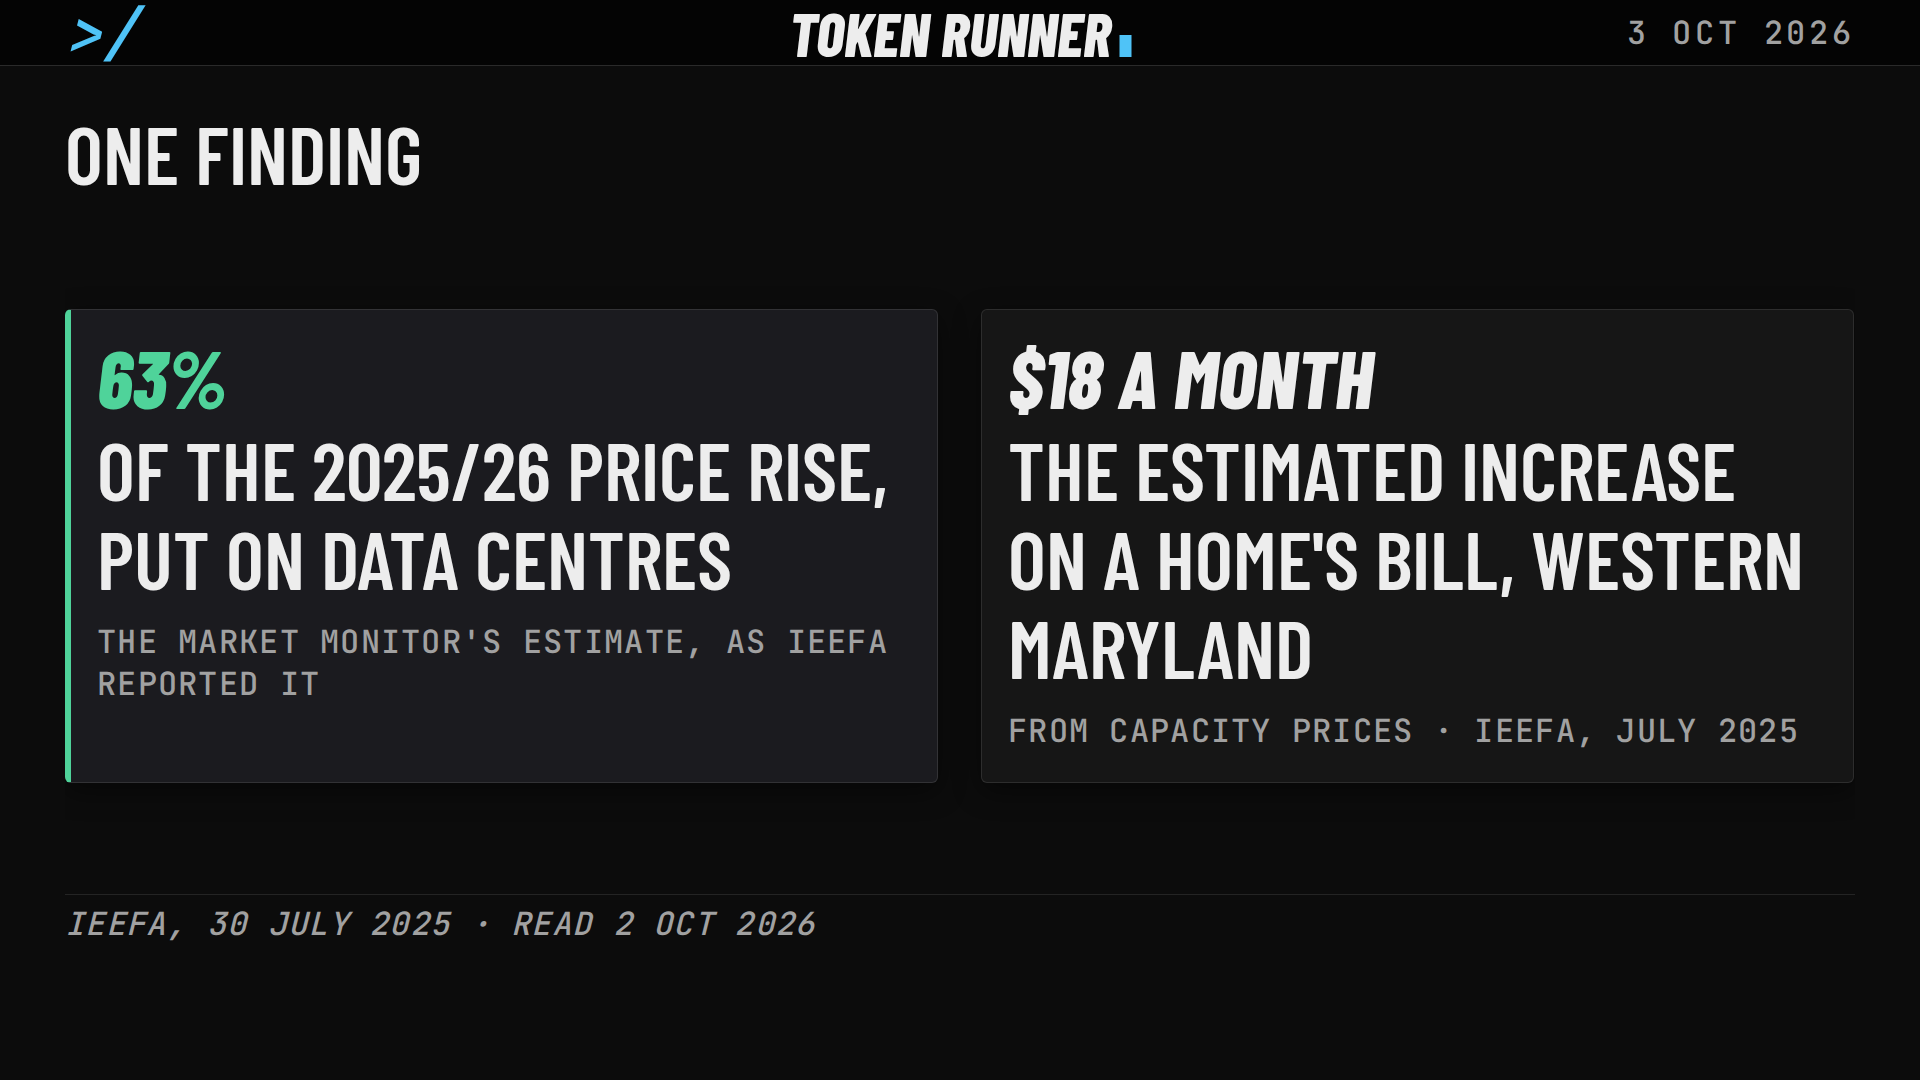
Who caused the rise? PJM's independent market monitor estimated, as IEEFA reported it in July 2025, that data centres were responsible for 63 per cent of the price increase in the 2025/26 auction: $9.3 billion to be recovered from customers across the region. IEEFA gives one bill in detail. Pepco's household customers in Washington, D.C., saw an average rise of $21 a month from June 2025, and the district's consumer counsel put about $10 of it down to capacity prices. IEEFA is an advocacy research group, and its piece argues a case. The same piece also says "there are strong reasons to believe that PJM's 20-year forecasts of data center growth are inflated". If so, households are paying now for demand that may not come. That reading is Token Runner's, not IEEFA's words.
The opposite finding
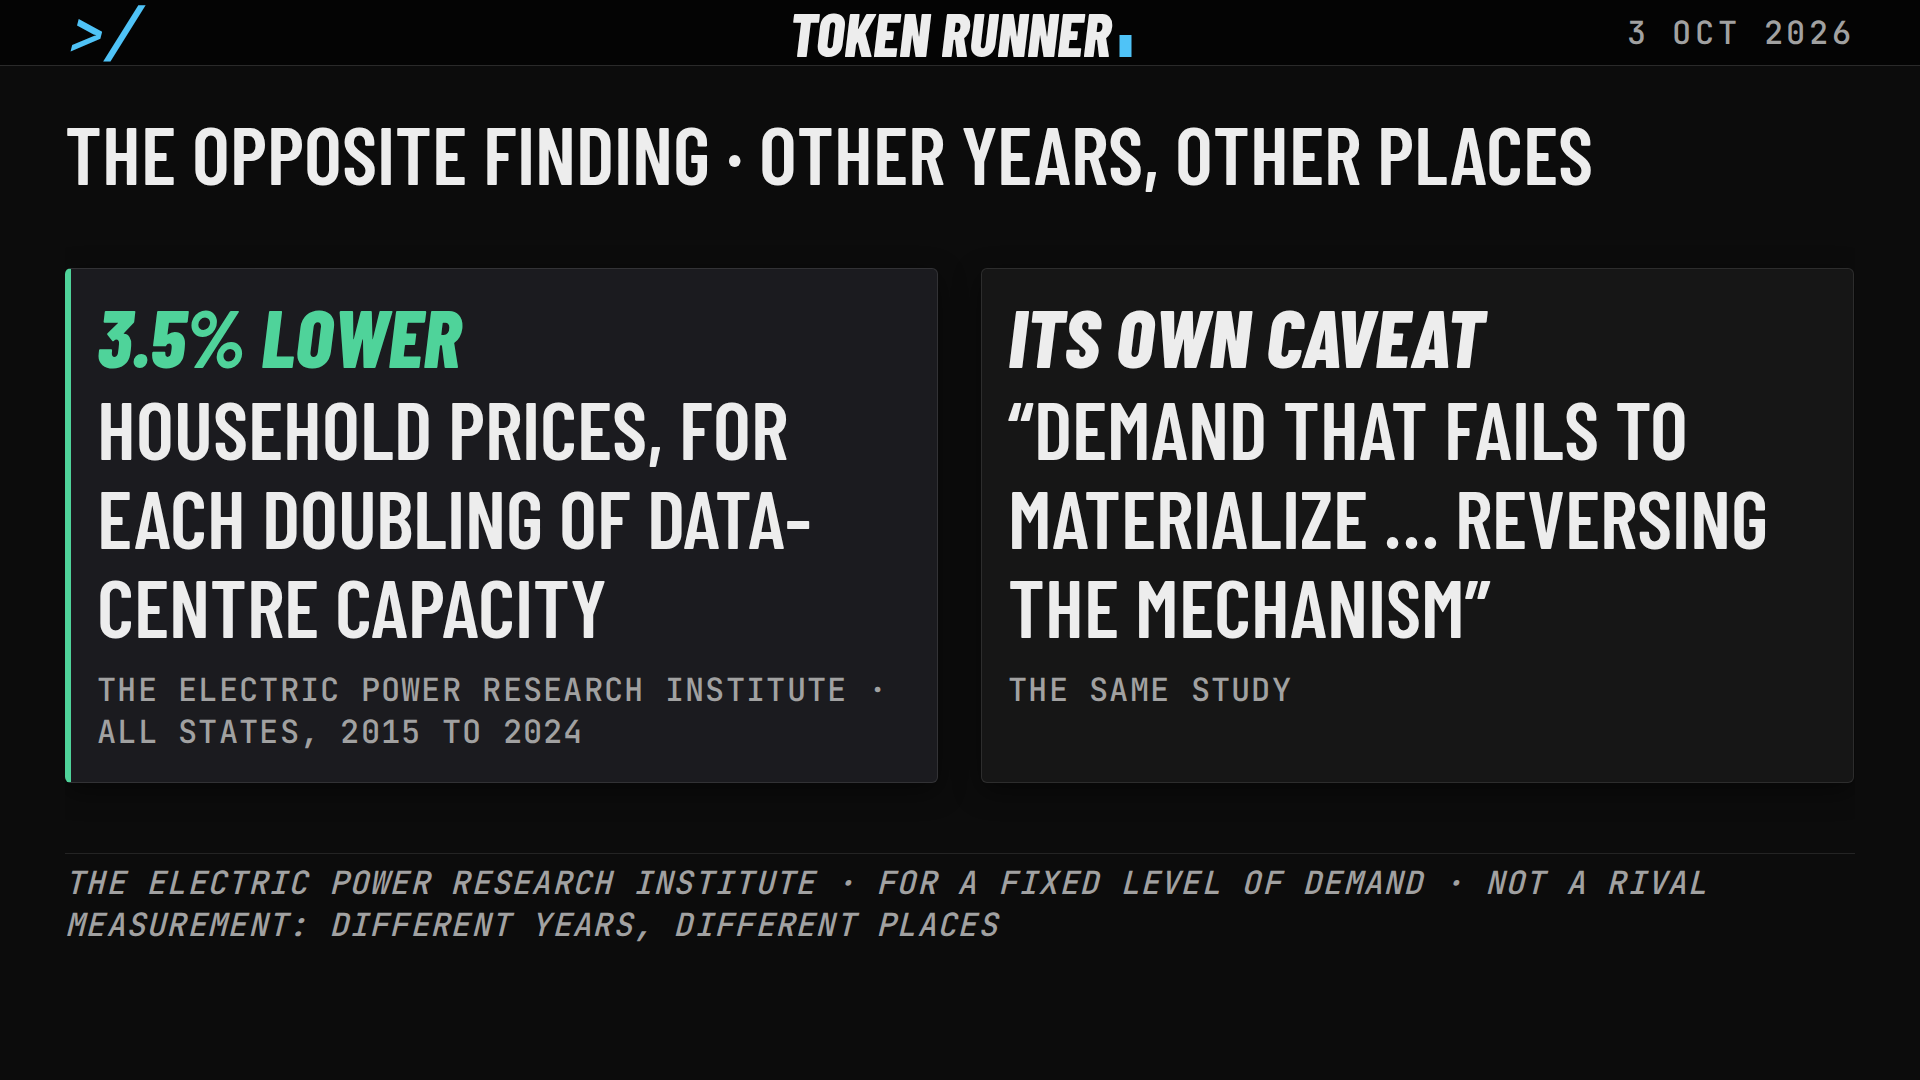
The Electric Power Research Institute finds the opposite, across all states from 2015 to 2024: a doubling of data-centre capacity left household prices 3.5 per cent lower, holding household demand fixed, with a range from 12.1 to 1.4 per cent lower. Its paper, a preprint, uses the length of the 1947 interstate highway plan in each state to separate where data centres went from what they did to prices, because fibre runs along the highways. Its own caveat comes with it: "We caution that future supply constraints could reverse the effect," the authors write, and the institute's brief says the benefit holds only if the load arrives and stays. The two findings are not rival measurements of one thing. One is a single region's auction in 2025. The other is every state in the years before.
Others who tried
Others have tried to separate where data centres are built from what they do to prices, and they do not agree. A draft by Kiran Garimella compares ZIP codes in 24 states before and after a data centre arrives, from 2014 to 2024. Its first estimate is $2.09 a month more on a household bill, only marginally significant, and $0.90 with no significance once the places are matched; its conclusion is that the evidence "does not robustly support" the claim that data centres materially raised bills. A preprint by Golden and others finds wholesale prices, not household ones, up by as much as 25 per cent in the PJM zones it treats. Berkeley Lab, with Brattle, finds that 10 per cent more load in a state went with overall prices 0.6 cents a kilowatt-hour lower from 2019 to 2024. The institute's paper gives the reason a plain comparison fails: "developers would be incentivized to locate in places where future electricity prices are expected to be low".
The bill
H.R. 9340, the Ratepayer Protection Act, was introduced on 18 June 2026 by Gabe Evans of Colorado, a Republican, with Kathy Castor of Florida, a Democrat. The committee reported it 52 to 0, and the House passed it 417 to 3 on 16 September 2026. It sets a standard: a large-load customer's rate should recover from that customer "the full, incremental cost of any generation, transmission, or distribution upgrade" needed to serve it, even if the customer later leaves. As passed, a large-load customer is one running data storage and computing with a peak demand of 100 megawatts or more on one site. States are not required to adopt the standard.
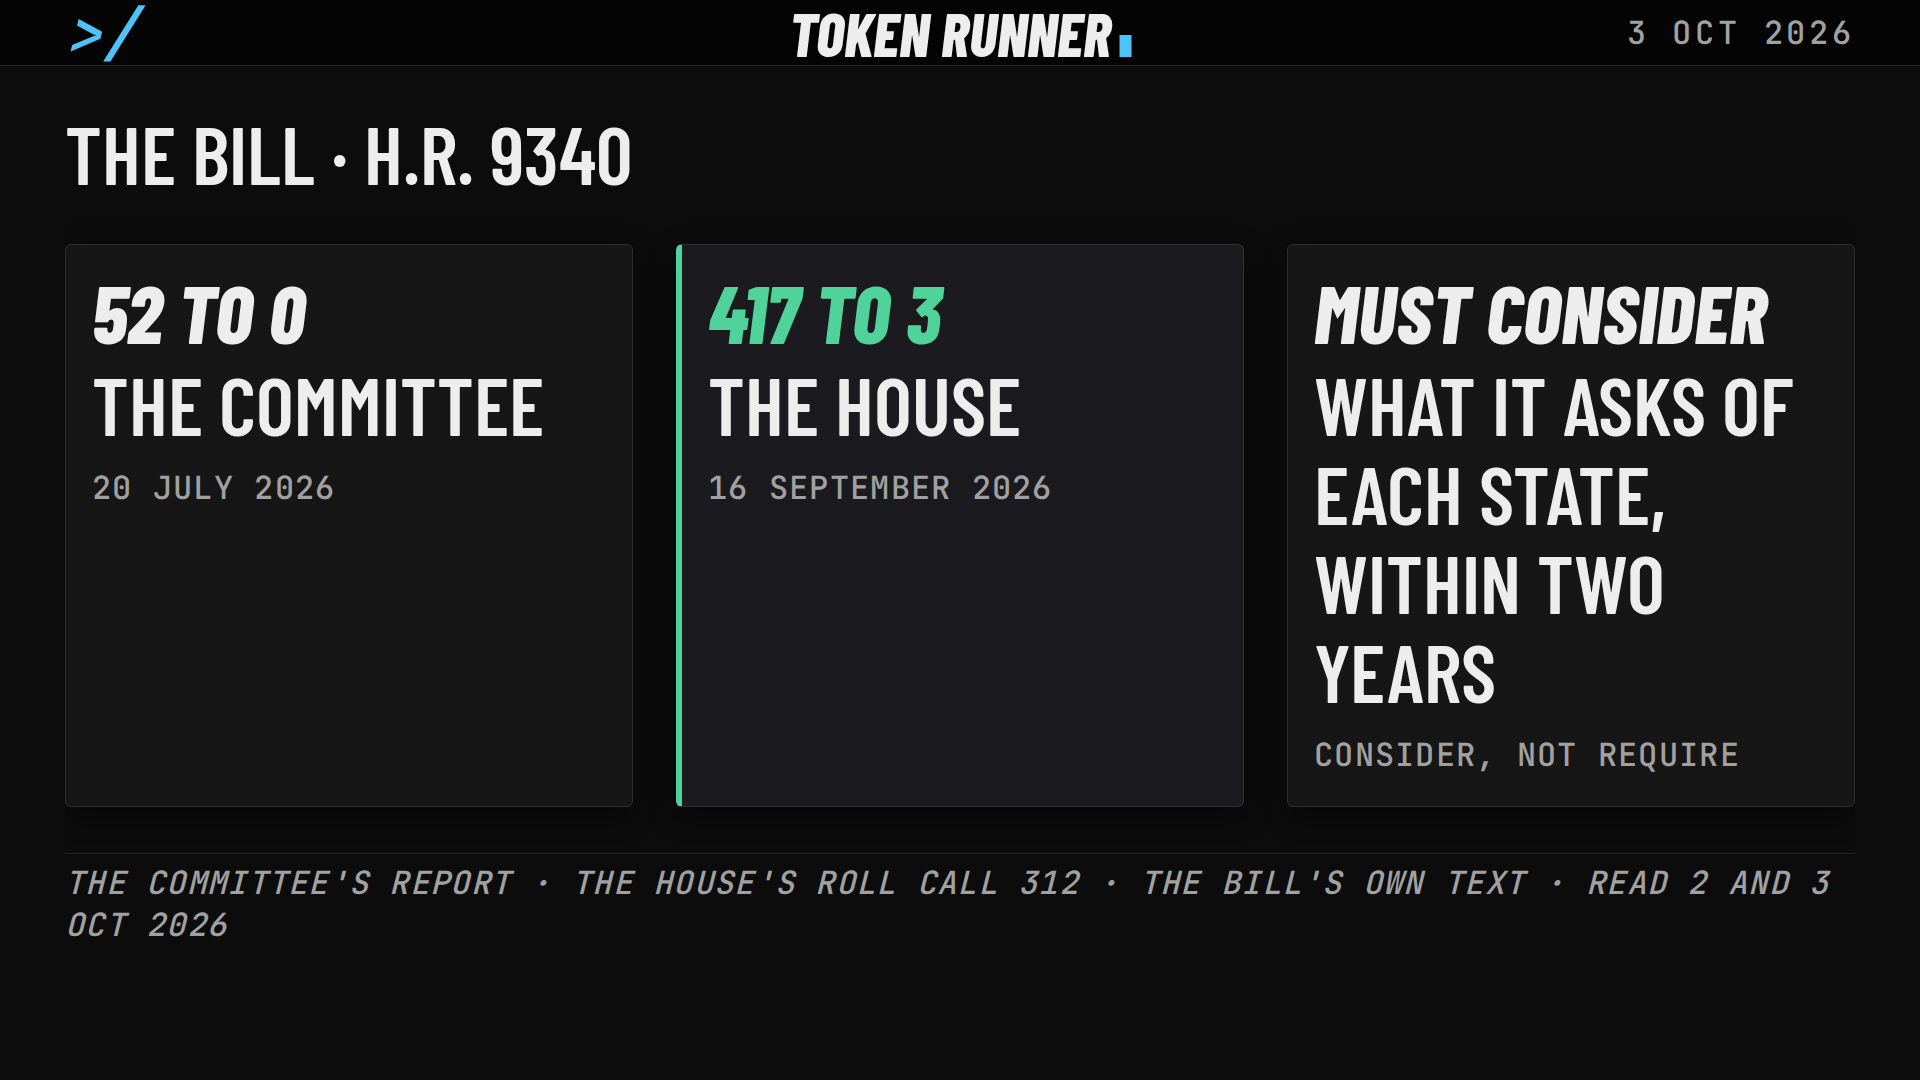
Each must begin considering it within a year and decide within two. The next day Senator Jon Husted of Ohio tried to pass it by unanimous consent, and Senator Martin Heinrich of New Mexico objected that it did not go far enough, the American Public Power Association reports.
The industry's case, and a state's
The electric companies' answer is that the protection is already being written. In a statement the day before the House vote, the Edison Electric Institute, the association of investor-owned electric companies, said that 25 states had approved at least one large-load tariff and seven more had one pending. It gave its members' own estimates, among them Entergy's: that its 2.3 million customers in Arkansas, Louisiana and Mississippi will realize $7 billion in total savings from its work with data centres, with no period and no method stated. North Carolina shows the state route. A task force its governor created in August 2025 made nine recommendations in its interim report, by Token Runner's count, and the first is to develop options for large-load tariffs. The governor's release also says that almost two thirds of the rise in the state's electricity bills "has been due to rising fuel costs".
What a kilowatt-hour emits
In 2025 a kilowatt-hour of electricity in the United States emitted about 384 grams of carbon dioxide on average, by Our World in Data's series: lower than the 608 of 2000 and the 412 of 2020, though it rose a little on 2024. The world's average was about 458 grams, China's 525, India's 670 and the European Union's 210. These are averages for all the electricity a country generates. A data centre draws from a particular grid, and some contract their own supply. Token Runner holds no figure by state or by grid region, so this article does not say what the tracked sites emit.
The forecasts
One more doubt is about the forecasts themselves. The Center for Strategic and International Studies, describing a paper by its own experts that was not read for this article, posted on 1 October 2026: "The disparity between national and regional electricity demand reflects the possibility of regional projections overcompensating for, or double-counting, large-load expectations". It is the doubt IEEFA and the Electric Power Research Institute raise from two other sides: IEEFA that the forecasts are inflated, the institute that its benefit reverses if the demand does not come. PJM's own forecast of peak load for 2028/29 was about 2,000 megawatts higher than the one it used the auction before.
What to watch
The price a household pays: 13.21 cents in July 2020, 18.31 in July 2026. The power the tracked data centres draw in the United States: about 11,851 megawatts by Epoch's estimate of 9 October; the film, made on the 2 October file, says 11,949. A table that sets the two side by side and cannot say who pays. An auction at its cap and short of its own requirement. Two findings that point opposite ways, for different years and different places. And a bill, passed 417 to 3 in one chamber and stopped in the other, that asks the states to consider who should pay. What to watch is what each state decides, what the regulators do with PJM's backstop, and whether the demand arrives.
Sources
- U.S. Energy Information Administration, average retail price of electricity by sector and by state, monthly; Token Runner's collection of 9 October 2026, July 2026 the latest month
- Epoch AI, the data centres file, as Token Runner collected it on 9 October 2026 (and on 2 October 2026, the collection the film was made with)
- Our World in Data, carbon intensity of electricity generation; Token Runner's collection of 9 October 2026
- PJM Interconnection, 'PJM Capacity Auction Procures 138,318 MW of Generation Resources as Work Continues To Address Growing Electricity Demand', PJM Inside Lines, 14 July 2026, read 2 October and 10 October 2026: https://insidelines.pjm.com/pjm-capacity-auction-procures-138318-mw-of-generation-resources-as-work-continues-to-address-growing-electricity-demand/
- Cathy Kunkel, 'Projected data center growth spurs PJM capacity prices by factor of 10', Institute for Energy Economics and Financial Analysis, 30 July 2025, read 2 October and 10 October 2026: https://ieefa.org/resources/projected-data-center-growth-spurs-pjm-capacity-prices-factor-10
- Wiser and others (Lawrence Berkeley National Laboratory) with Hledik and others (The Brattle Group), 'Factors Influencing Recent Trends in Retail Electricity Prices in the United States', October 2025, read 2 October 2026: https://eta-publications.lbl.gov/sites/default/files/2025-10/full_summary_retail_price_trends_drivers.pdf
- Electric Power Research Institute (Watten, Bistline, Blanford), 'Have Data Centers Raised Your Electric Bill?', a brief of the 2026 white paper of the same name, read 2 October 2026: https://restservice.epri.com/publicattachment/98650
- Watten, Bistline and Blanford (Electric Power Research Institute), 'Have Data Centers Raised Your Electric Bill? Causal Evidence from the United States', arXiv:2606.19777 v1, submitted 18 June 2026 (a preprint), read 2 October and 10 October 2026: https://arxiv.org/abs/2606.19777
- Kiran Garimella, 'Do Data Centers Raise Residential Electricity Prices? Evidence from 24 U.S. States', a preliminary draft on the author's own site, June 2026, the abstract read 2 October 2026: https://gvrkiran.github.io/content/AI_data_centers_electricity_bills.pdf
- Golden and others, 'Certificates without Electrons? Theory and Evidence on Impacts from AI-Driven Power Demand', arXiv:2606.00811 v2, 2 August 2026 (a preprint), the abstract read 2 October and 10 October 2026: https://arxiv.org/abs/2606.00811
- H.R. 9340, the Ratepayer Protection Act, 119th Congress: as introduced, 18 June 2026: https://www.govinfo.gov/content/pkg/BILLS-119hr9340ih/html/BILLS-119hr9340ih.htm ; as passed by the House, 16 September 2026, read 10 October 2026: https://www.govinfo.gov/content/pkg/BILLS-119hr9340eh/html/BILLS-119hr9340eh.htm
- House Report 119-814, the committee's report on H.R. 9340, 10 September 2026, read 2 October 2026: https://www.govinfo.gov/content/pkg/CRPT-119hrpt814/html/CRPT-119hrpt814.htm
- Clerk of the U.S. House of Representatives, Roll Call 312, 16 September 2026, read 10 October 2026: https://clerk.house.gov/Votes/MemberVotes?BillNum=H.R.9340&Session=2nd&CongressNum=119
- American Public Power Association, 'Ratepayer Protection Act is Blocked in Senate', read 10 October 2026: https://www.publicpower.org/node/31252
- American Public Power Association, 'FERC Accepts PJM Proposed Reliability Backstop Procurement, But Suspends It for Five Months', read 10 October 2026: https://www.publicpower.org/node/31356
- Edison Electric Institute, 'America's Electric Companies Protect Customers by Ensuring Data Centers Pay Their Fair Share', 15 September 2026, read 2 October and 10 October 2026: https://www.eei.org/News/news/All/2026-ratepayer-protection-act
- Office of the Governor of North Carolina, 'Governor Stein's Energy Policy Task Force Releases Interim Report', 16 February 2026, read 2 October and 10 October 2026: https://governor.nc.gov/news/press-releases/2026/02/16/governor-steins-energy-policy-task-force-releases-interim-report
- Center for Strategic and International Studies, a post on X, 1 October 2026: https://x.com/CSIS/status/2105704415126560887